Field tests
From the battery storage to the villages
Three consecutive field tests put the island grid to the test step by step with more and more plants.
Field test 1 · 2 October 2024
The battery carries the island grid
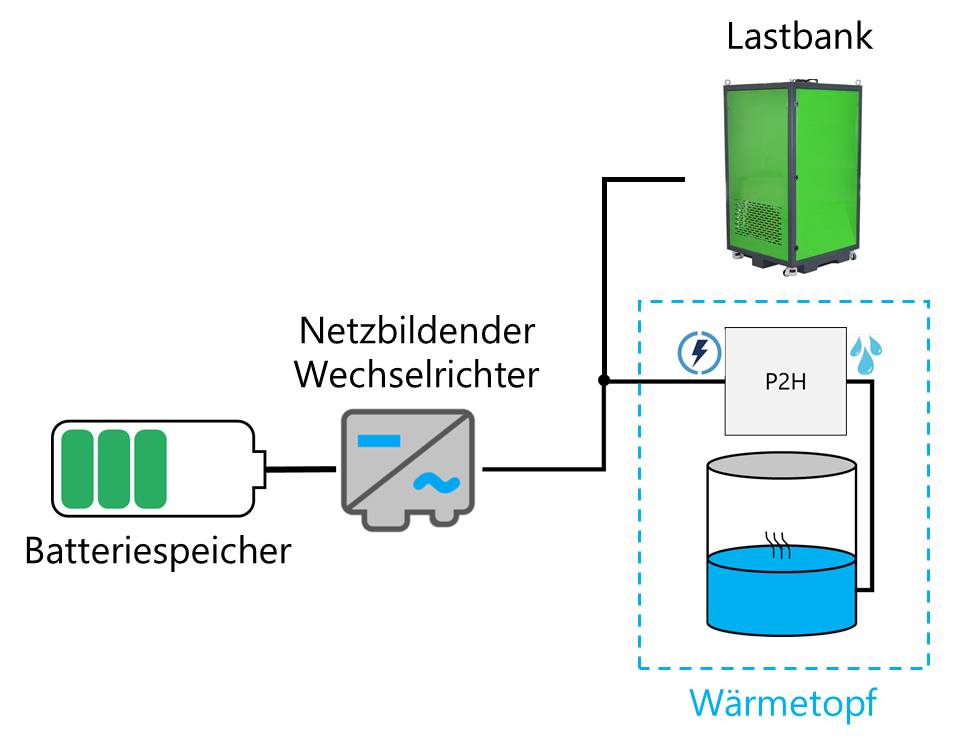
In the first field test, the two grid-forming battery inverters formed the island grid on their own. The loads were the power-to-heat plant (active load), an inductive load bank (around 1 Mvar) and a cable section of about 9 km (capacitive).
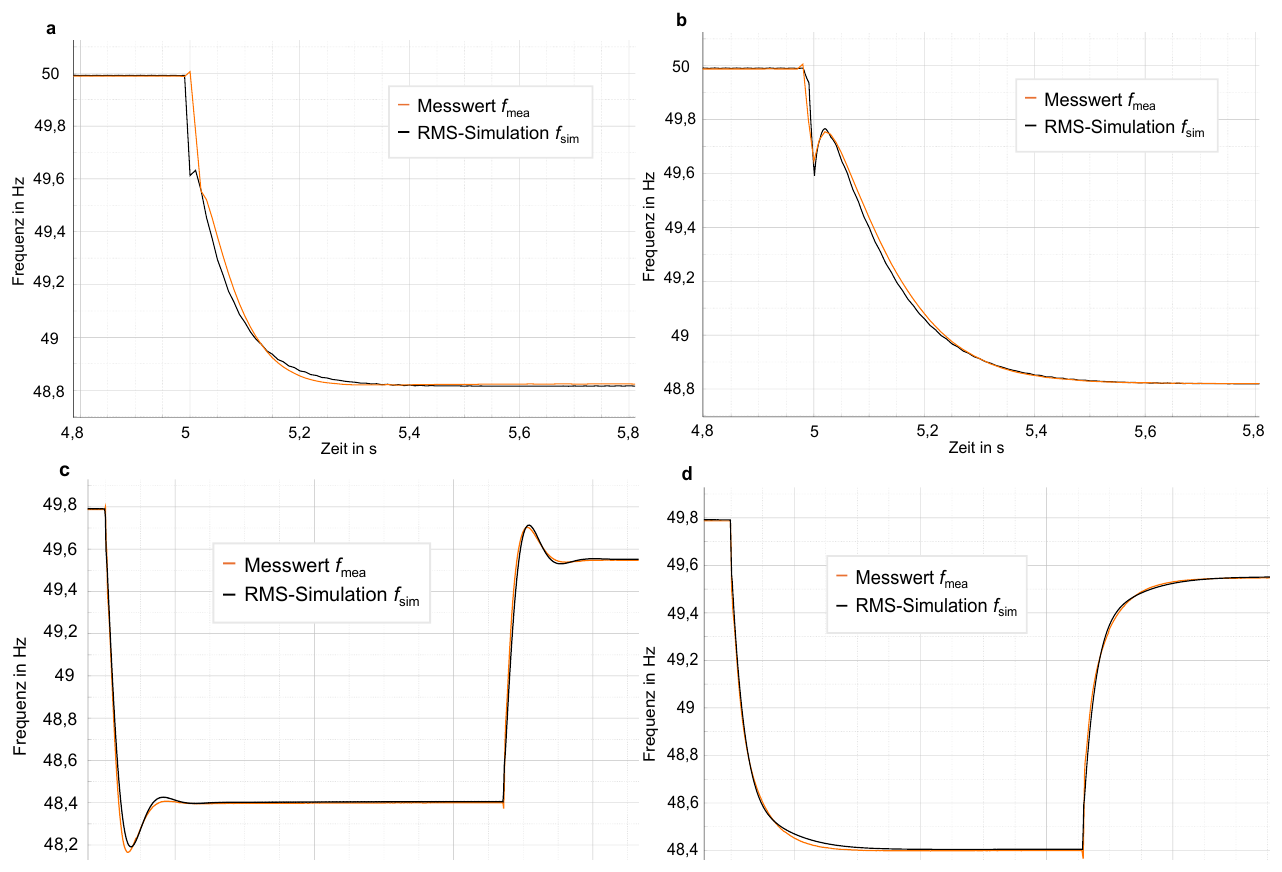
By switching these loads on and off in a targeted way, the dynamic and steady-state behaviour of voltage and frequency was investigated – with the control methods droop and virtual synchronous machine (VSM) and a total of 15 parameter scenarios.
Findings
- Island grid operation works: An operating strategy was developed for establishing an island grid after a blackout, in which the grid is formed exclusively by the grid-forming inverters.
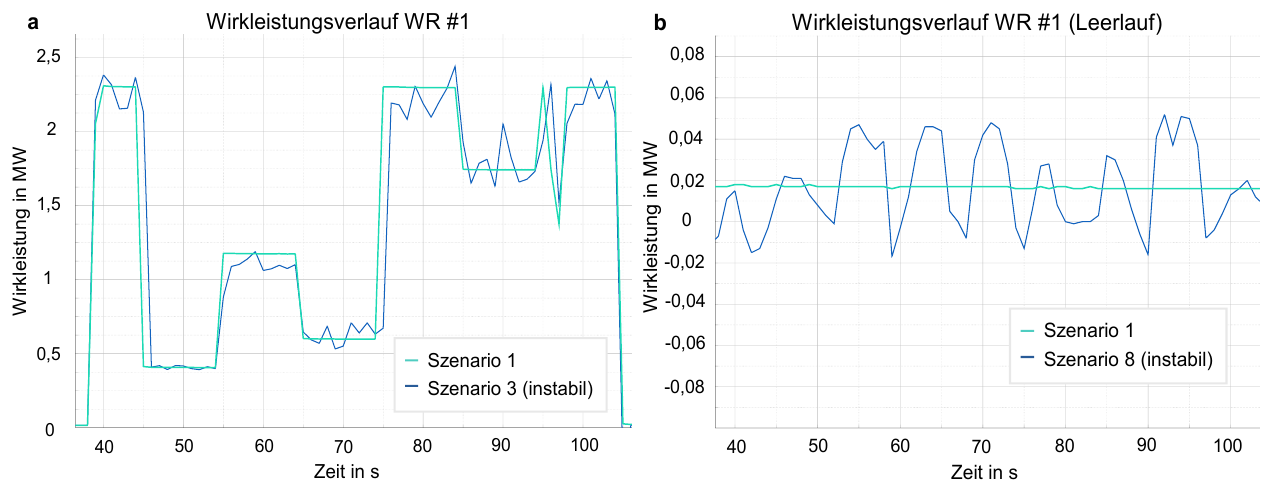
- Parameter settings are crucial: With certain settings (e.g. higher measurement time constants in the droop control), power oscillations occurred between the two inverters. Some scenarios were therefore stopped as a precaution. In subsequent simulations, the VSM control proved to be robust.
- The choice of model matters: RMS models represent the frequency and voltage behaviour well. Interactions between grid-forming inverters, however, can only be detected with EMT simulations.
- Inrush currents as a challenge: Energising transformers causes high inrush currents. If magnetised transformers are already connected to the grid, the effect is amplified (“sympathetic inrush”). The resulting overvoltages can cause the island grid to trip.
- Energy demand: One test cycle required around 4 % of the storage capacity. The energy management model was validated with the measurement data.
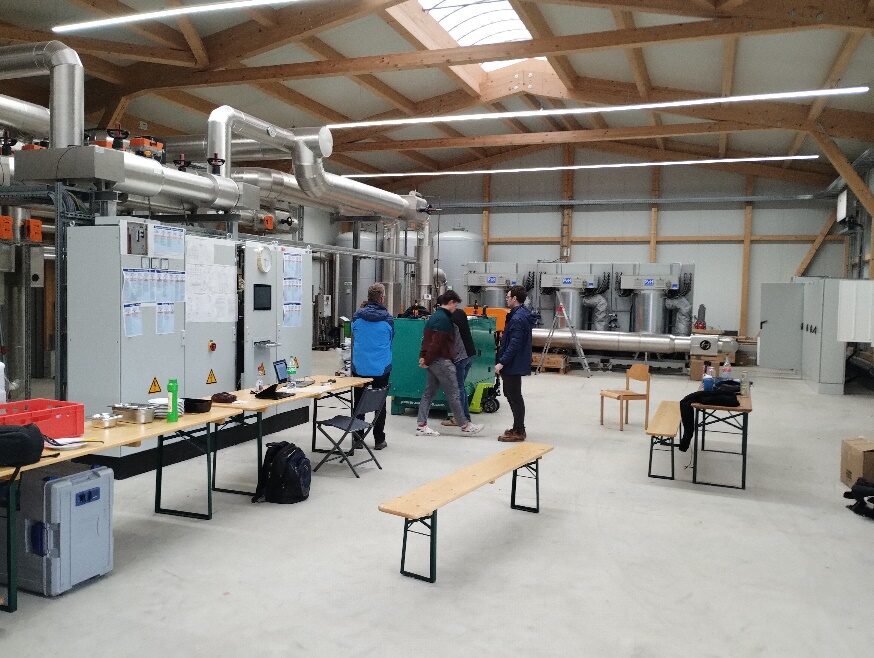
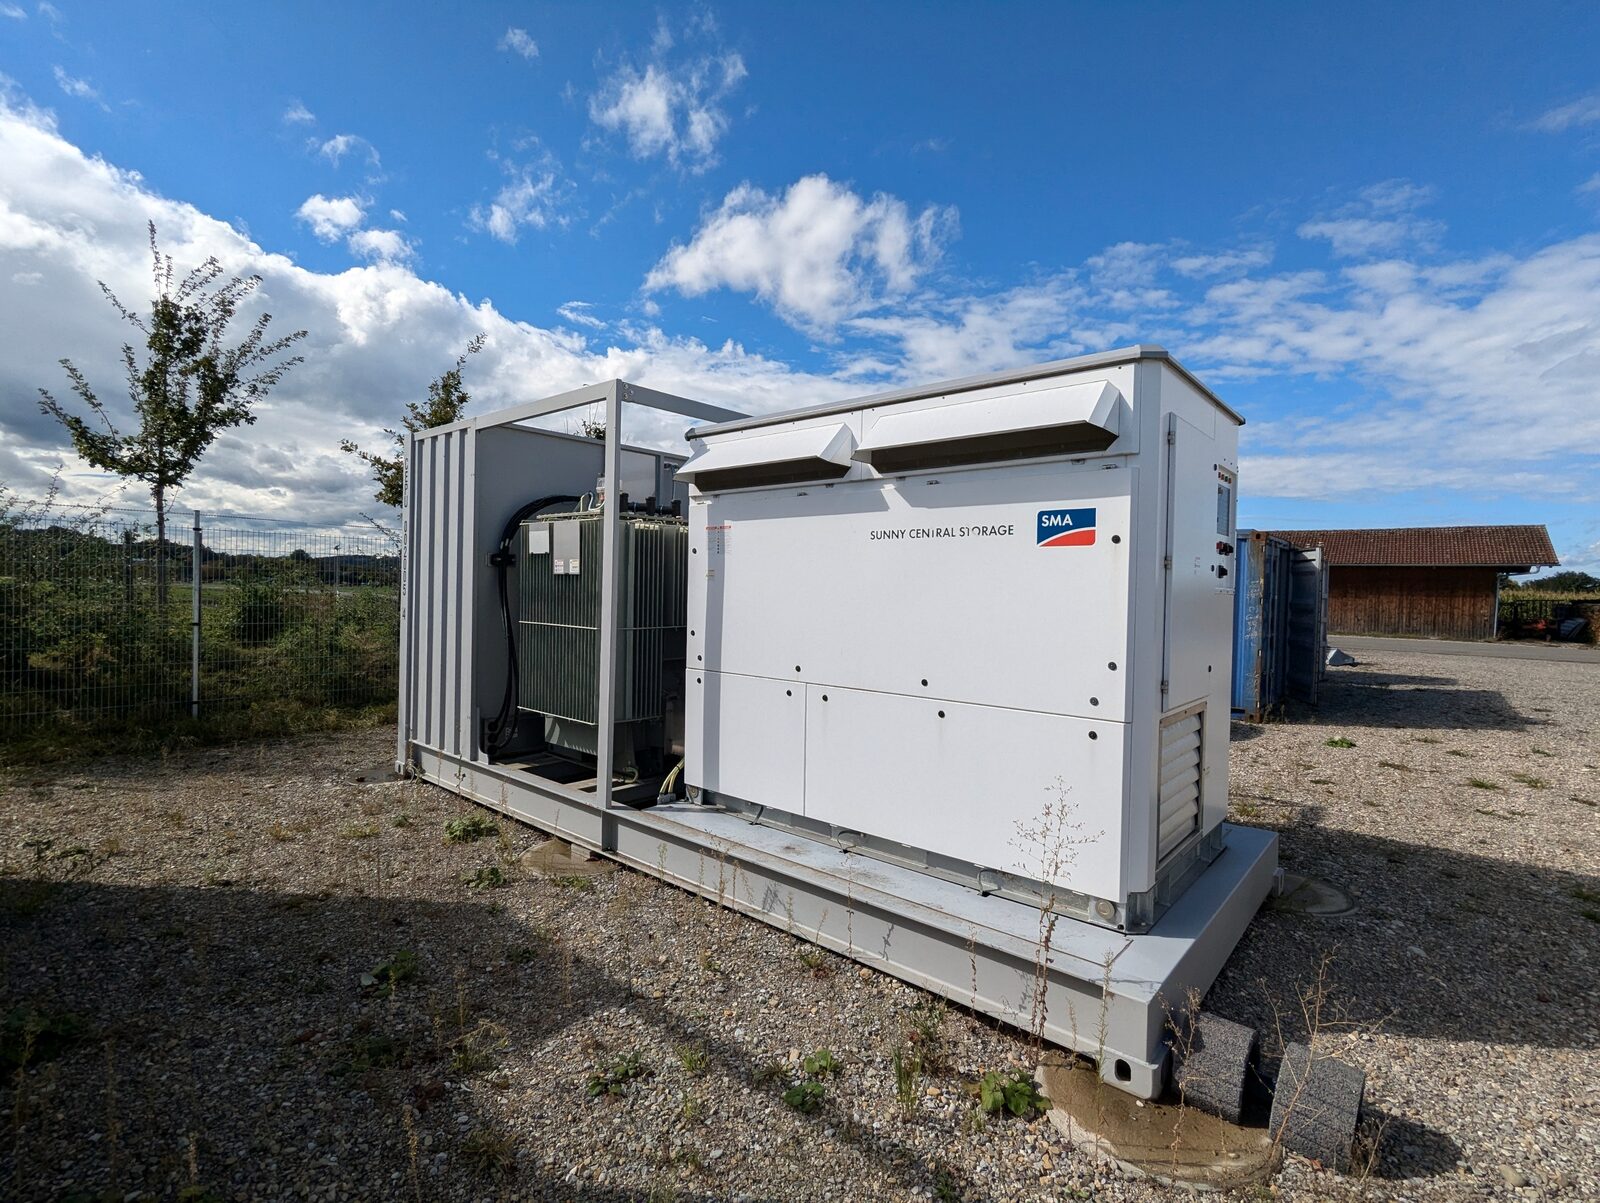
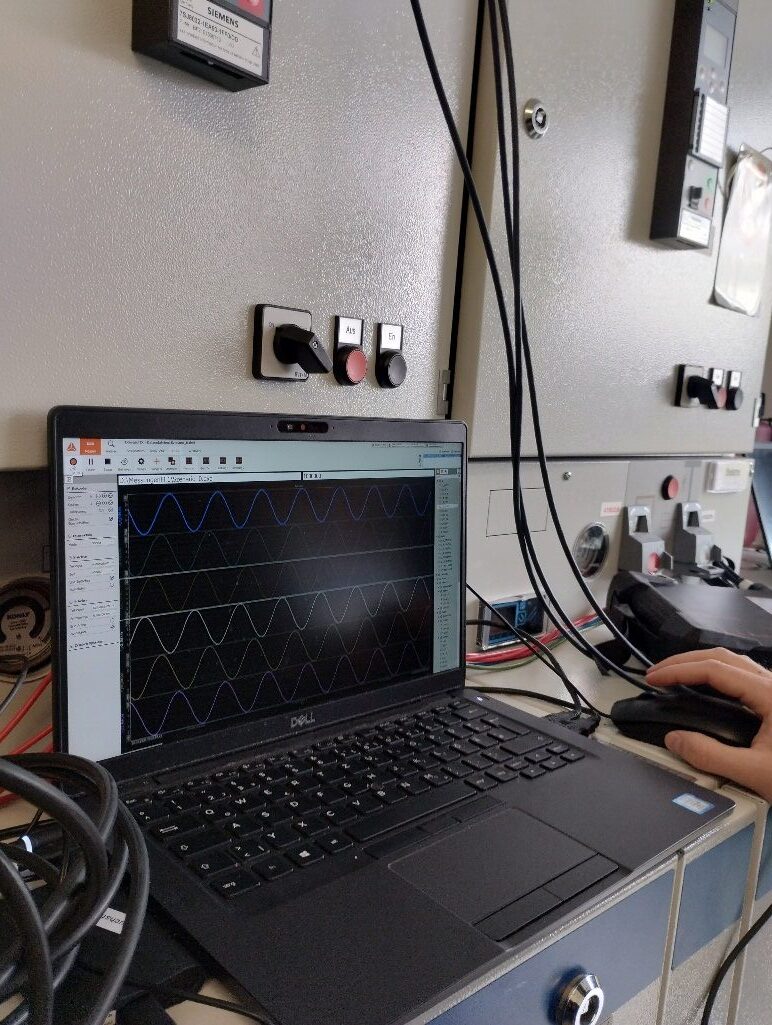
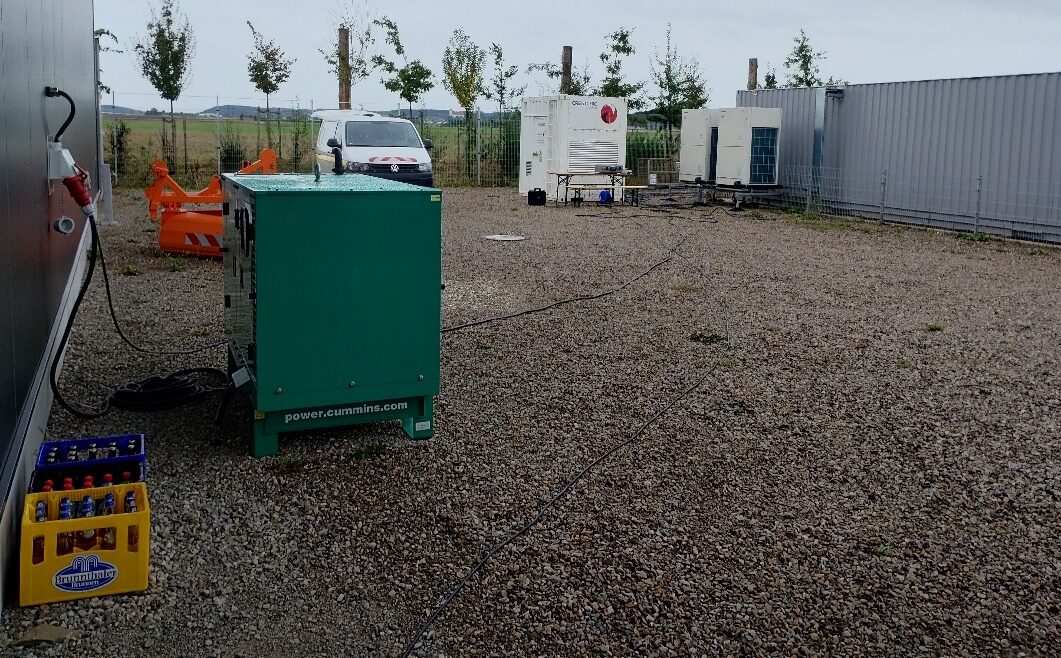
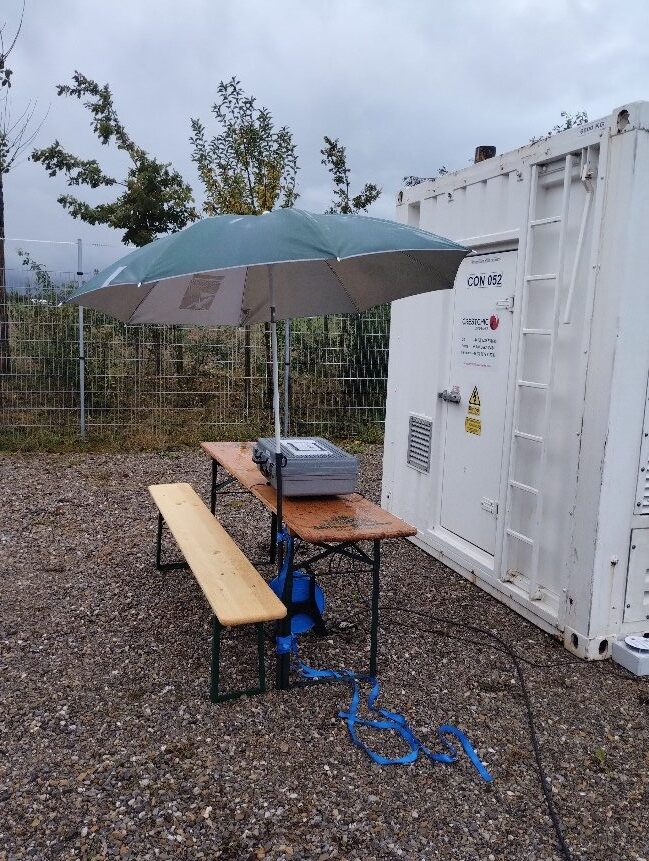
Impressions from the test day
Field test 2 · 16–18 September 2025
The wind farm feeds into the island grid
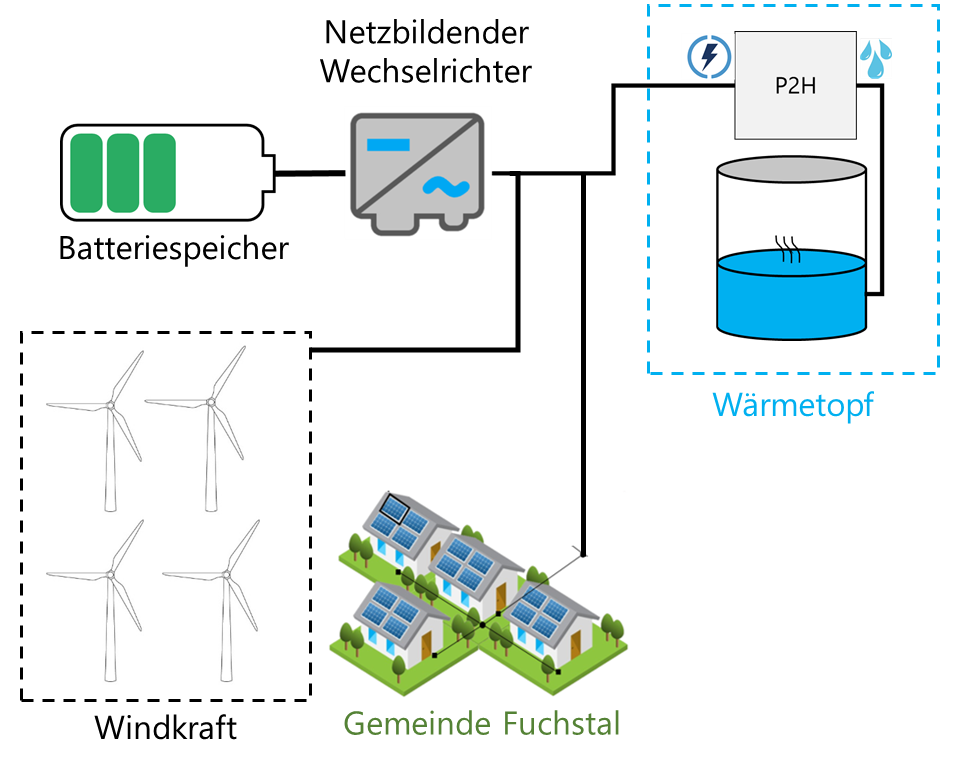
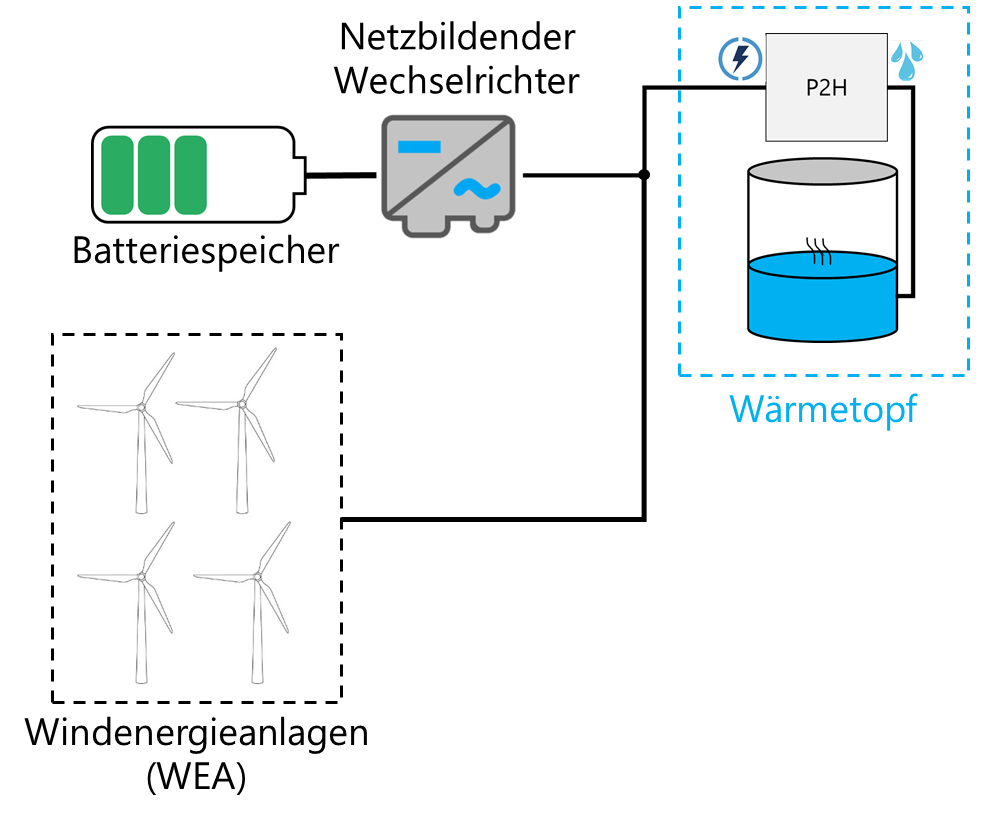
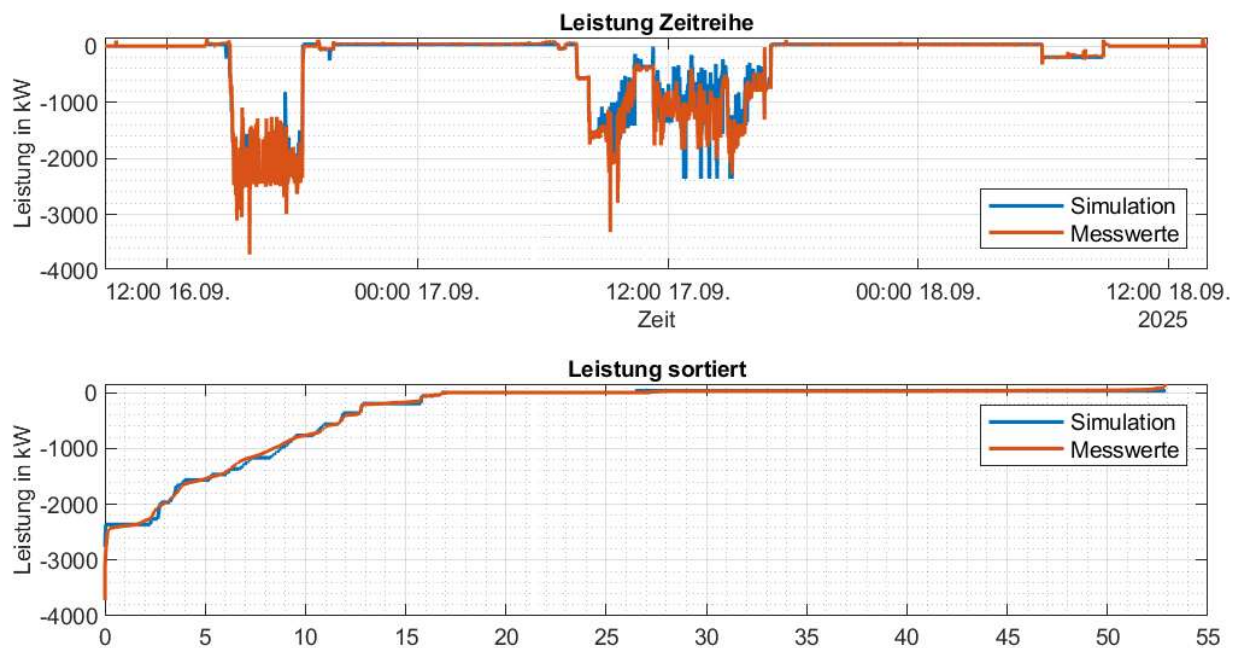
In the second field test, the four wind turbines were added. The battery storage was now loaded by the power-to-heat plant and charged by the wind farm at the same time. The focus was on the interaction of grid-forming and grid-following plants with the characteristics of the technical connection rules: P(f) and Q(U).
Because the energy in the island grid comes only from the battery and the wind, the test was spread over three days (16 to 18 September 2025) with flexible test blocks. Risk and energy management accompanied the tests.
Findings
- Three days of stable island grid operation purely from wind and battery, including charging overnight.
- Precise energy planning: Over the entire field test, the energy system model deviated by less than 5 % from the measured amounts of energy.
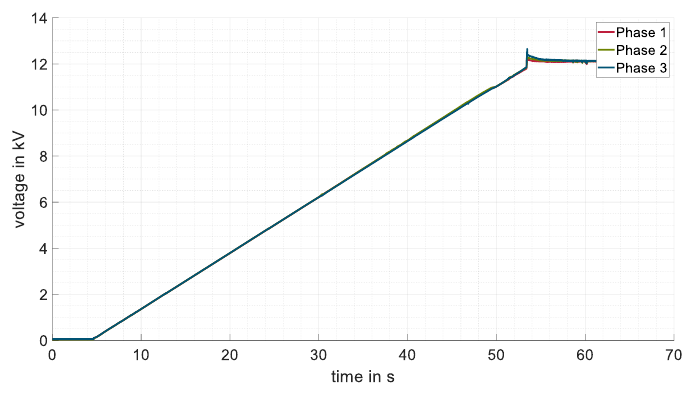
- Countermeasures against inrush currents tested: slower voltage ramp-up (“soft energisation”), changed tap positions of the transformers, more inverter power and adapted Q(U) characteristics. More inverter power made it possible to energise all transformers.
- Harmonics are the key: The overvoltage trips are mainly caused by harmonics. Better harmonic stability of the inverters is therefore the next starting point.
- Staff are the most important risk factor: Risk management according to DIN ISO 31000 shows that the availability of the specialists from all companies involved is decisive for success.
Field test 3 · week of 23–27 November 2026
Asch and Leeder in the island grid
In the final field test, two villages of the municipality of Fuchstal, Asch and Leeder, will be disconnected from the regular power grid. They will then be supplied as an island grid for half a day, solely by four wind turbines and the battery storage system.
The test will also investigate whether, and for how long, the two villages could continue to be supplied with electricity if the power supply collapsed.
- Transition from interconnected to island grid operation
- Voltage tolerances in the medium- and low-voltage grid
- P(f) and Q(U) characteristics of the PV systems in the low-voltage grid
- Voltage- and frequency-dependent behaviour of the loads
- Operating strategies and possible supply duration during a longer outage of the interconnected grid
Goal: practical proof that stable island grid operation is possible in a converter-dominated grid without a central control structure.